In Chapter 65 – Gap Management I demonstrate a bar graph tool that I use to measure where my time is dedicated. The problem in the printed book is that it is black and white, and the color coding makes it easier to see.
Here are some examples for employees, students and entrepreneurs:
The black boxes represent sleep.
The grey ramp represents preparation time.
The red boxes represent constraints, these are tasks or scheduled items that you must attend, even though you may not want to.
The Blue boxes represent residual income.
A green ramp represents offense tasks for residual income earners.
An orange box represents defensive tasks.
Everything above the line represents conscious effort, everything below it non-conscious effort, such as earning residual income. 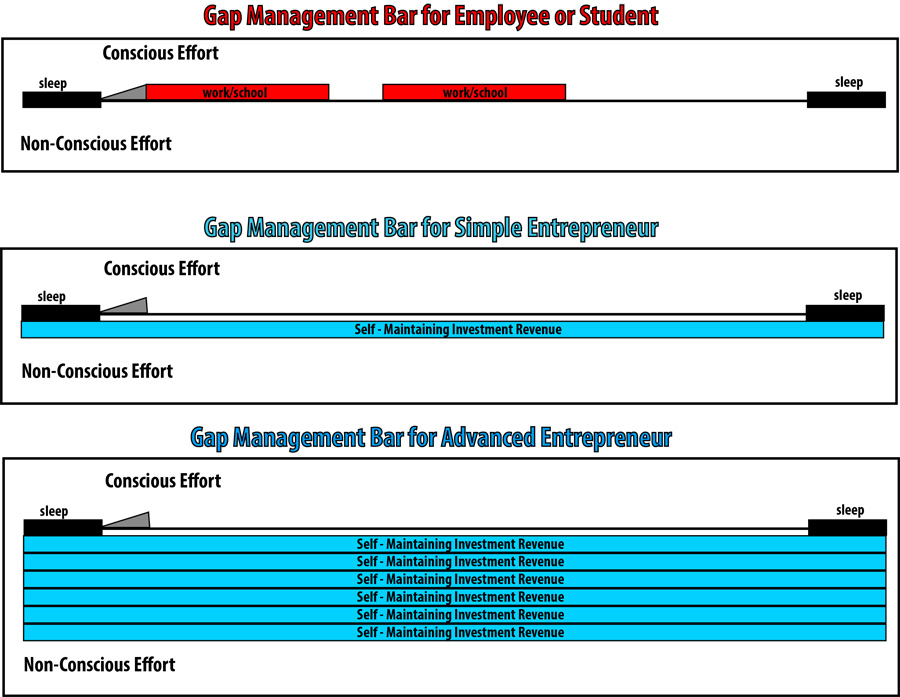 This is an example of what I try to accomplish schedule wise everyday. There is great flexibility in this concept, but generally this is what I aim for. I sometimes put very difficult defensive tasks first if it is something that only I can do:
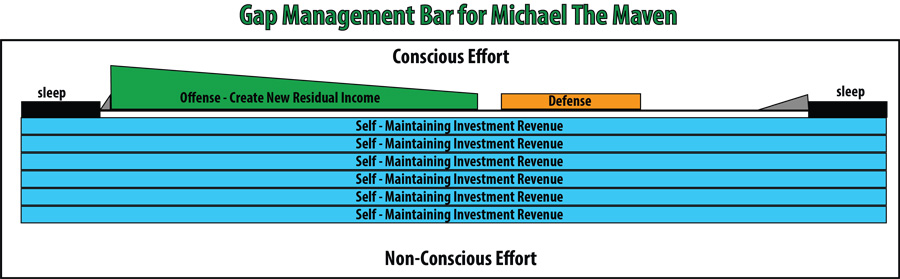 An example for those with many constraints who are looking to get out of that cycle, wake up a little early to work on whatever it is you are trying to accomplish:
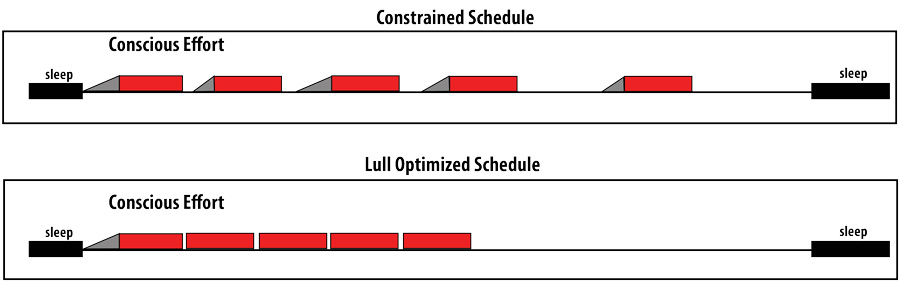
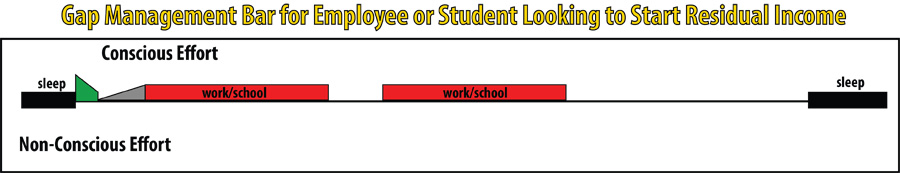 Lull Optimizing- basically means to find ways to remove unnecessary gaps and transitions in your schedule to create larger gaps of time, even if the number and time of constraints do not change. This demonstrates how spacing and reducing lulls can improve efficiency.